
Phenology Tool
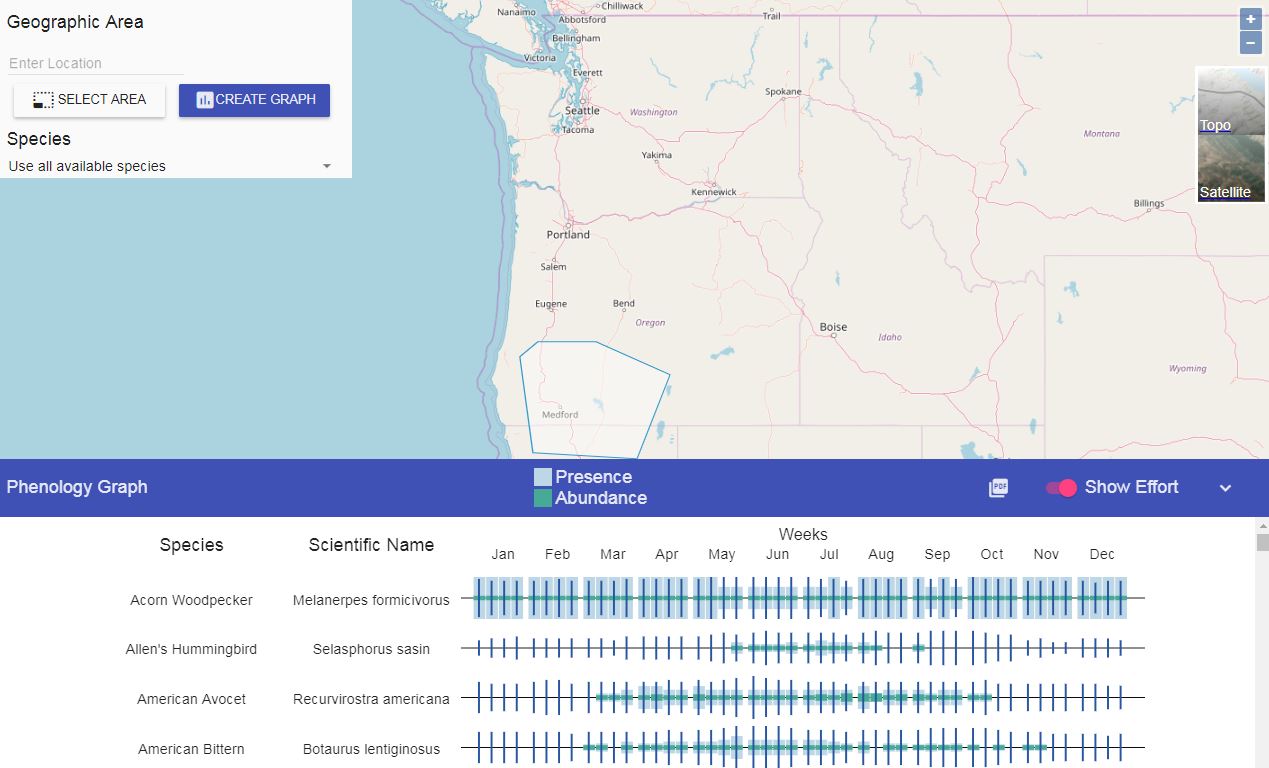
This interactive mapping tool generates a graph that provides our best understanding of when birds are most likely to be present in a selected area. The graph includes information about presence, abundance, and effort
This interactive mapping tool generates a graph that provides our best understanding of when birds are most likely to be present in a selected area. The graph includes information about presence, abundance, and effort

 This tool integrates future projection maps for of 31 focal bird species in Oregon and Washington allow managers and planners to view and download the projections.

 This mapping tool allows you to explore Avian Knowledge Northwest datasets. It also allows specific queries based on a set of overlays (e.g., county, watershed). Click here to access this tool.


This tool was designed to inform management with information about the effects of climate change on bird species found in western Washington, Oregon and California. Click here to access this tool.