
Phenology Tool
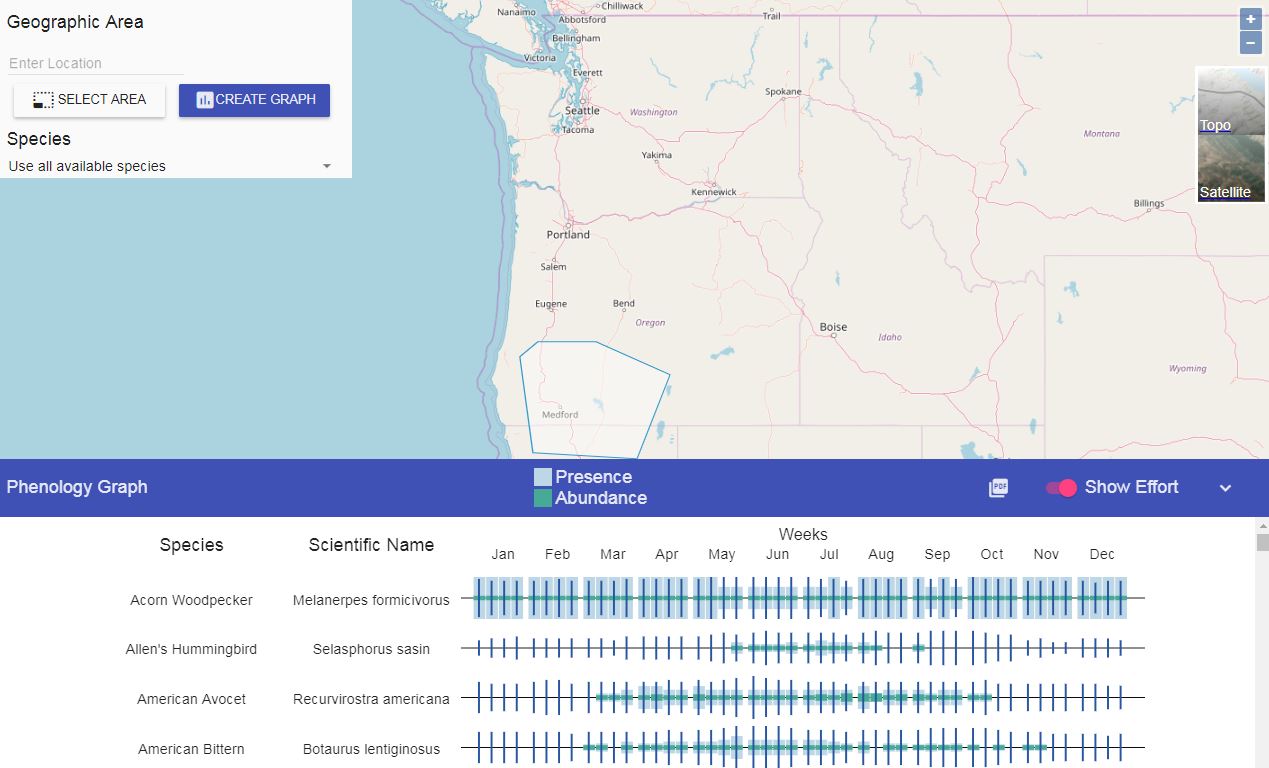
This interactive mapping tool generates a graph that provides our best understanding of when birds are most likely to be present in a selected area. The graph includes information about presence, abundance, and effort
This interactive mapping tool generates a graph that provides our best understanding of when birds are most likely to be present in a selected area. The graph includes information about presence, abundance, and effort